
Underground Cable Fault Detection Using Arduino

Introduction
Identifying subterranean cable flaws is essential to keeping a dependable power distribution system in place. MArobotics provides a new solution for “Underground Cable Fault Detection Using Arduino,” which focuses on identifying and displaying defects in the cable network. This project uses Arduino technology to accurately identify and highlight problems in subterranean cables, displaying the fault type (RYB) and the distance to the fault in kilometers on an LCD display. MArobotics’ revolutionary solution solves important difficulties in cable infrastructure by providing a dependable and effective technique for detecting defects, locating them, and permitting rapid repairs. This application has great promise for enhancing the reliability and maintenance of subterranean cable networks. This blog post presents a prototype for underground cable fault detection using Arduino. By effectively identifying cable defects, the technology seeks to improve power distribution networks’ dependability.
DISCLAIMER:
Friends, please note that this project is only demonstrative and cannot be used in actual situations. This project can only, technically, identify line-to-ground problems. It doesn’t need AC power; it just uses DC power. A 5V relay is turned on and off by a digital pin on the Arduino, which regulates each of the aforementioned phases’ operation at a 5V level. Through the use of a resistor and a separate voltage source, the relay eventually prevents the circuit from being completed. The vertical line that represents the ground shortens horizontally with one of the phases when the switch is switched on. A filtered supply is sent to the Arduino’s ADC pin, and the programming may interpret the value as a distance. This project was all my own, and I also included a GSM module that relayed messages to mobile phones and the display. It is important to know that this project just follows the voltage division rule and does not follow any other principles for those who are interested in doing it. You may, however, construct it for demonstrative reasons. I admire the effort put out by the film developer and have no complaints about the way it was made. It is essential to make clear, nonetheless, that this initiative is not relevant to real-world situations. I’m grateful.
Components Required
- Veroboard 18cm x 30cm
- 12V 5Pin Relay x 3
- 4007 Diode x 3
- 16 Pin IC Base
- ULN2003
- Slide Switch x 12
- 10k Variable Resistor
- 100R Resistor x 16
- 12V Buzzer
- Blue LED
- Yellow LED
- Red LED
- Male Header
- Female Header
- 12V 2Amp Power Adapter
Proteus Simulation
An Arduino UNO, a buzzer, and a 16×2 LCD are used as the starting points in the virtual environment of the Proteus 8 simulation for the Underground Cable Fault Detection project, which simulates the behavior of an electronic circuit. A 10k ohm potentiometer is used to control the contrast. Then an IC ULN2003 is added, and three relays that stand for phases 1, 2, and 3 are added after that. Three series 100 ohm resistances for each phase are used in the cable simulation, and fault generating switches are positioned at 100, 200, 300, and 400 ohms. The wire is pulled up by a 1k ohm resistor and attached to the Arduino’s A0 pin. Three LEDs are also included in the setup: red, yellow, and blue. The code is compiled in the Arduino IDE, and the hex file address is copied to create a hex file that is used to run the simulation. Next, paste this address into Proteus’s Arduino simulation settings. The LCD first shows a welcome message as the simulation runs. After that, errors in the red, yellow, and blue phases are shown. When there are no defects, the LCD displays “No Fault (NF)”, and the buzzer sounds an alarm, which stops when the fault is fixed. A complete virtual picture of the dynamics of cable failure detection is provided by feeding the signals from the consecutive phase checks into the Arduino’s A0 pin with a 5000-millisecond delay.
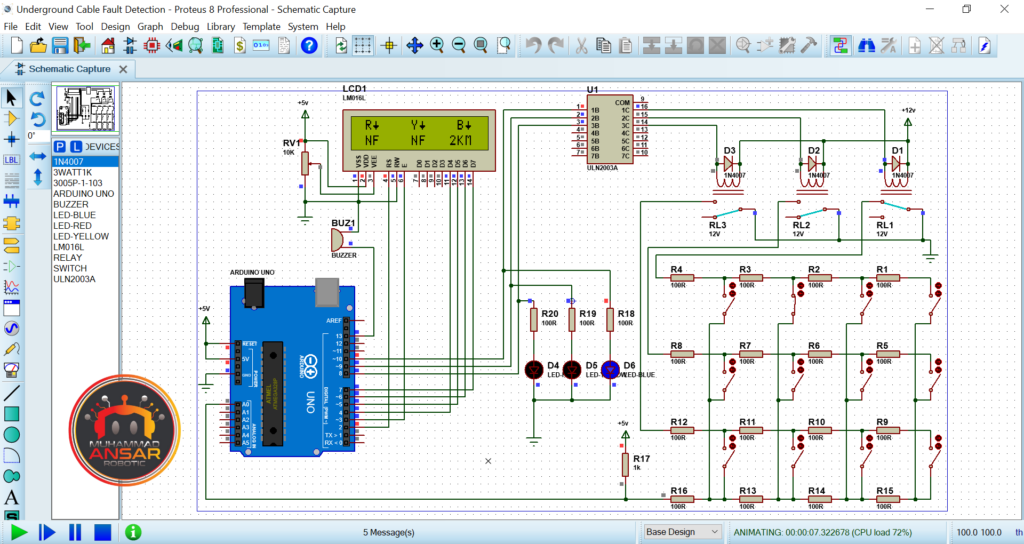
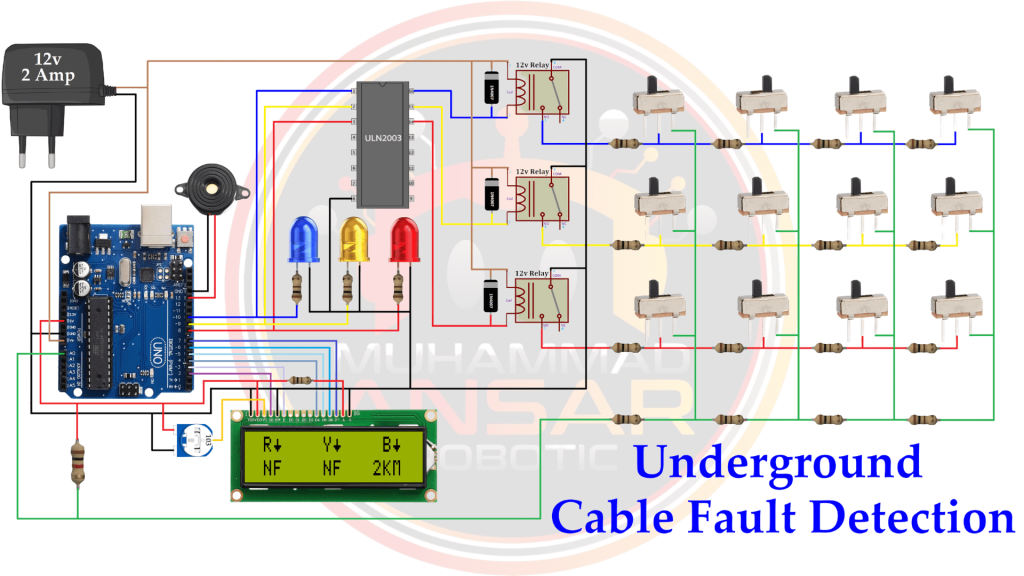
Circuit Diagram
The circuit diagram displays the connections between every part, demonstrating the relationships between the LEDs, diodes, Arduino, relay, and other components. To comprehend the electronic structure of the project, one must grasp this visual portrayal.
Arduino IDE Code
#include <LiquidCrystal.h>
LiquidCrystal lcd(2,3,4,5,6,7);

#define sensor A0

#define relay1 8
#define relay2 9
#define relay3 10

#define buzzer 13

int read_ADC;
int distance;

byte symbol[8] = {
        B00000,
        B00100,
        B00100,
        B00100,
        B11111,
        B01110,
        B00100,
        B00000};

void setup() {
pinMode(sensor,INPUT);

pinMode(relay1, OUTPUT);
pinMode(relay2, OUTPUT);
pinMode(relay3, OUTPUT);

pinMode(buzzer, OUTPUT);

lcd.createChar(1, symbol);

lcd.begin(16, 2);
lcd.clear();
lcd.setCursor(0, 0); // set the cursor to column 0, line 2
lcd.print("Welcome to Cable");
lcd.setCursor(0, 1); // set the cursor to column 0, line 2
lcd.print("Fault  Detection");
delay(2000);
lcd.clear();
}

void loop(){
lcd.setCursor(1,0);
lcd.print("R");
lcd.write(1);

lcd.setCursor(7,0);
lcd.print("Y");
lcd.write(1);

lcd.setCursor(13,0);
lcd.print("B");
lcd.write(1);

digitalWrite(relay1,HIGH);
digitalWrite(relay2,LOW);
digitalWrite(relay3,LOW);
delay(500);

data();
lcd.setCursor(0,1);
if(distance>0){lcd.print(distance); lcd.print("KM  ");}
else{lcd.print(" NF ");}

digitalWrite(relay1,LOW);
digitalWrite(relay2,HIGH);
digitalWrite(relay3,LOW);
delay(500);

data();

lcd.setCursor(6,1);
if(distance>0){lcd.print(distance); lcd.print("KM  ");}
else{lcd.print(" NF ");}

digitalWrite(relay1,LOW);
digitalWrite(relay2,LOW);
digitalWrite(relay3,HIGH);
delay(500);

data();

lcd.setCursor(12,1);
if(distance>0){lcd.print(distance); lcd.print("KM  ");}
else{lcd.print(" NF ");}

}


void data(){
read_ADC = analogRead(sensor);
distance = read_ADC/100;

if(distance>9)distance = 0;

if(distance>0){
digitalWrite(buzzer,HIGH);
delay(200);
digitalWrite(buzzer,LOW);
delay(200);
 }
}
Explanation
The Arduino code that is supplied is intended for a project that detects faults in underground cables. The code establishes pin connections for three relays (relay1, relay2, relay3), a buzzer, and an analog sensor (A0). It also uses the LiquidCrystal library to drive a 16×2 LCD display. The analog sensor reading and the computed distance are stored in two global variables, read_ADC and distance, respectively. An arrow-like custom symbol is made for the LCD display. Pin modes are configured and a custom LCD character is formed in the setup function. An introductory message appears on the LCD. The primary logic is continually carried out via the loop function. Sequential relay activation is done, and an LCD with arrows indicating the direction of the cable defect are displayed. The software computes the distance, reads data from the analog sensor, and shows the result on the LCD. In the event that a defect is found, the buzzer sounds momentarily. Three simulated cable portions are cycled through while the pattern repeats. The data function is in charge of reading the analog sensor, figuring out how far something is, and sounding the buzzer when a problem is found. Through the LCD and buzzer, the software simulates the identification of problems in various parts of an underground wire, offering both visible and aural feedback. The entire dependability of subterranean cable systems is increased by this approach, which makes it possible to evaluate cable sections for any problems in a methodical and sequential manner.
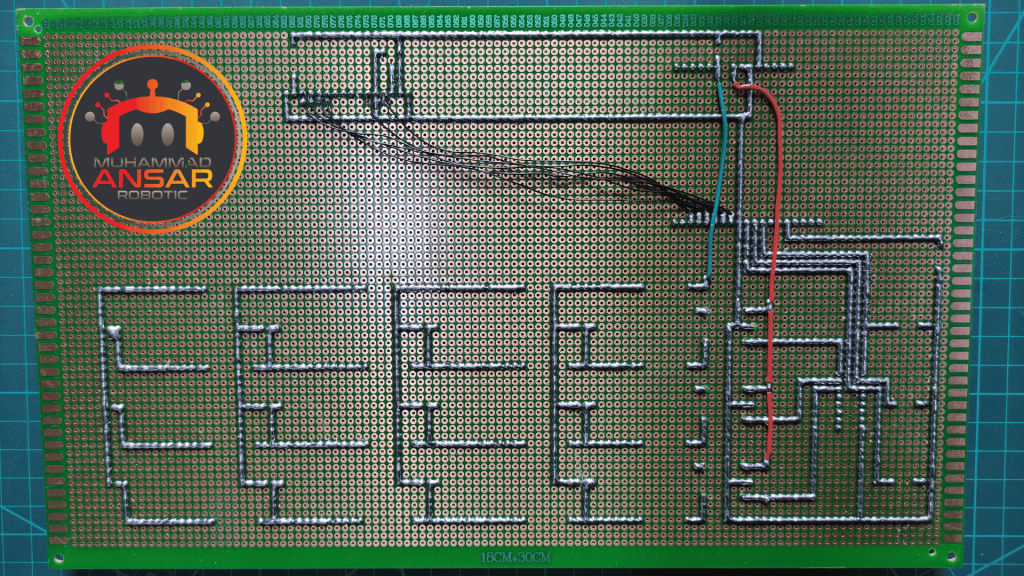
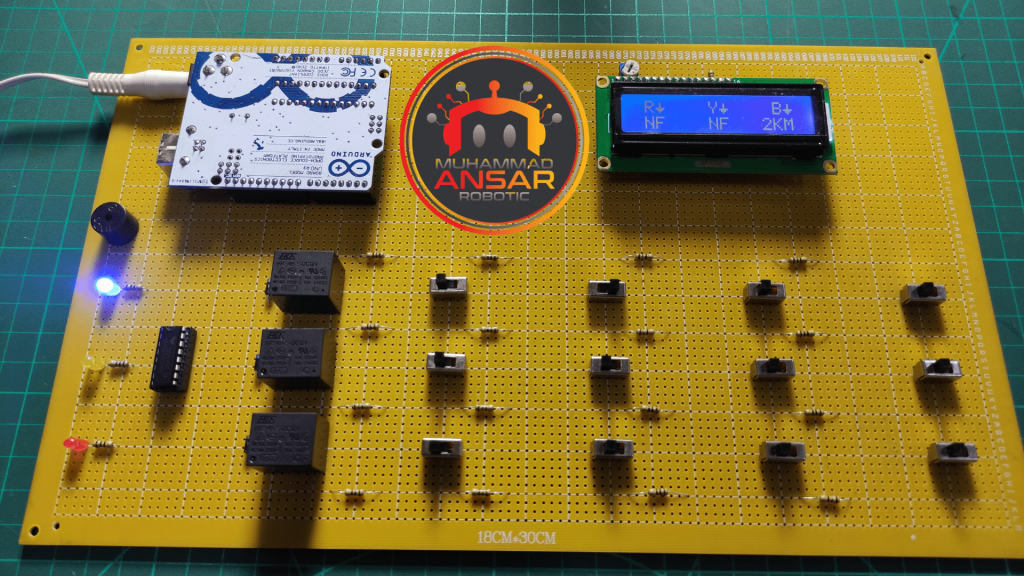
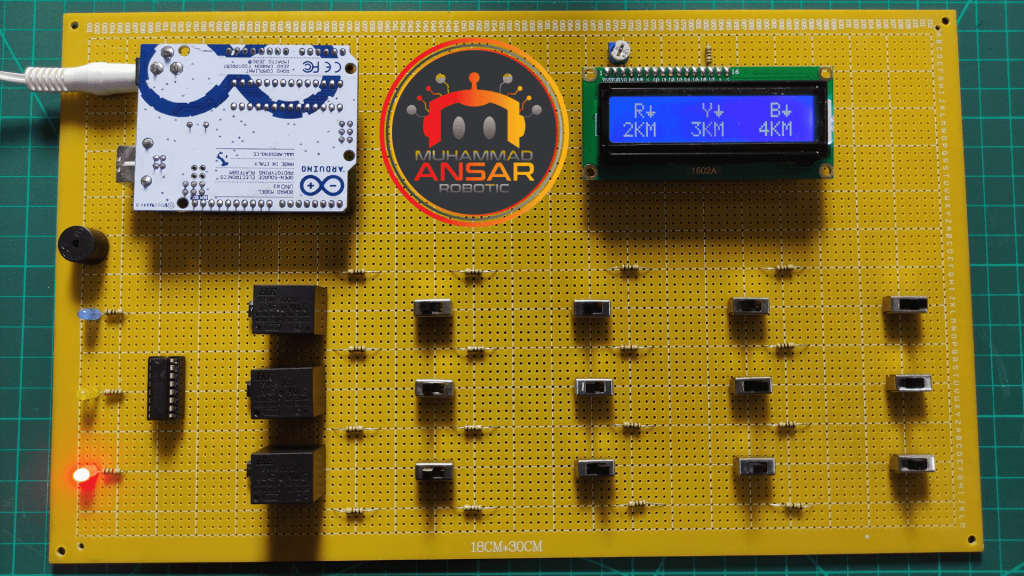
Hardware Testing
Hardware testing may now be done after the parts have been assembled using the circuit diagram as a guide and the code has been uploaded to the Arduino. During this phase, it will be verified that every part works as it should and that the system correctly identifies and shows issues with subterranean cables on the LCD.
Conclusion
To sum up, this research on Underground Cable Fault Detection offers a practical way to find problems in power distribution cables. Subterranean cable monitoring and troubleshooting is made dependable and effective by integrating Arduino with a variety of electrical components. Power distribution networks might benefit greatly from this project’s maintenance and enhancement, which would increase their overall dependability and reduce downtime.


Leave a Reply